
Prime Renter Cohort Analysis
Learn more about the build process for this project
4/13/20233 min read
You can view the live interactive dashboard on Tableau Public here.
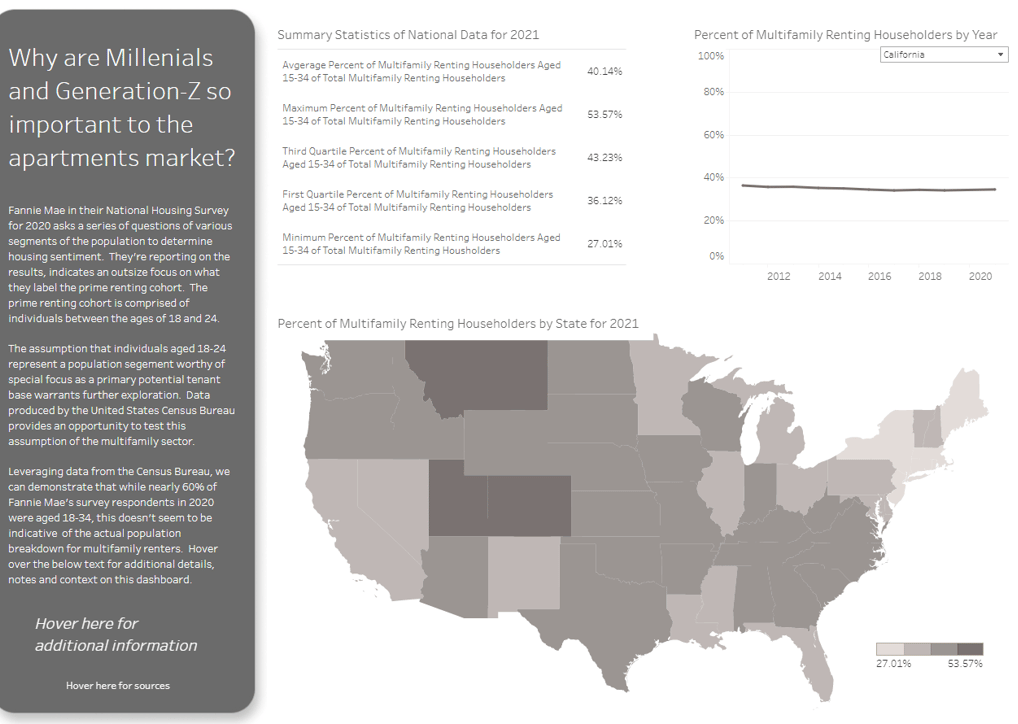
While working in the commercial real estate industry as a data analyst I discovered the emphasis that is placed on what is called the prime renter cohort by the industry. People aged 18-34 often receive additional attention from commercial real estate investment and property management firms as a primary prospective tenant base. Marketing strategies and property amenities can often end up tailored to this group due to the industry's belief that this population makes up the bulk of renters.
Having lived only in major metropolitan areas in California and New York, where people often rent well beyond the age of 34, I often questioned whether the focus on people aged 18-34 was an effective strategy in the multifamily space. Unfortunately, this project was not a priority while I was working in commercial real estate. When I began building a portfolio to assist in my job search I realized I now had the time and freedom to explore these types of questions.
While working in the multifamily space, I worked with data from the Census Bureau so I was familiar with the API. The Census Bureau produces a tremendous amount of data and understanding the available data points can be challenging. Having experience with the API helped in the process of identifying the required variables.
I was unfortunately not able to find the exact data on how many people of specific ages that are renting in multifamily housing options. I was able to identify the total population in each state of people within specific age ranges and the total population who are renting. I decided I could use this to calculate the maximum potential renters of a specific age range and use this as a barometer to test whether or not it seemed likely that people aged 18-34 were the predominant tenant base
I wrote a python script to pull the required data from the API end point and exported this data into excel for loading into Tableau. This data from the Census Bureau is only updated on an annual basis, therefore there was not much of a need to build a full data pipeline. I then designed a layout in Figma and built the dashboard in Tableau without much issue.
Challenges arise
After the dashboard was fully built and launched I moved onto to other projects. I often find I get new inspiration and ideas when I'm not focusing directly on a project. It's when I'm cooking dinner or in the gym that a new solution pops into my head. I experienced something similar with this project after having moved onto working on another dashboard. I was never quite happy with this project as I was not able to capture the specific data points required to answer the question and this was often in the back of my mind while working on the next project.
I eventually came to the realization that it was quite likely that the Census Bureau made the specific data points available that this project required. I must have missed it when exploring the end point initially. I decided to go back and to the drawing board and scour the documentation on the API. Ultimately I was correct, and was able to identify the exact number of people renting multifamily homes within specific age ranges.
Unfortunately this meant I had to go back to step one and completely rebuild this project. Thankfully, the code I had already written and much of the work I did in Tableau made the project go much quicker during the rebuild process. I tweaked my python script to pull the new data points and changed some of the data transformation that I had coded. I had to do a full rebuild in Tableau, but the design and layout work I had already done made this step quite efficient.
Lessons learned
While there was a fairly significant set back with this project that required completely starting over, overall it went smooth and wasn't particularly challenging. The primary lesson I learned from this project is a lesson I've learned over and over again throughout my career. That lesson is to always take as much time as possible at the beginning of a project to fully understand the project objective and the available resources before beginning to build.
I'm a big fan of science fiction and fantasy novels and Frank Herbert, the author of Dune, specifically. My experiences from this project reminds me a quote from Mr. Herbert. "A beginning is the time for taking the most delicate care that the balances are correct." The balance in terms of how much time should be allocated to a project, is allocating the most time to the beginning. A dashboard is like an iceberg and most of the work is done below the surface and can not be seen by the end user. This is an import lesson to remember when starting any new project.